How optimising BESS cycling can improve project IRR
By Claudio Alemany · Optimus Consulting · 25 September 2026
Why battery power, storage capacity and hourly dispatch should be evaluated together.
A fixed assumption of one battery cycle per day can shape an investment decision before the best BESS configuration has been identified. The economically attractive solution may operate at 0.8, 1.1 or 1.3 equivalent full cycles per day, with a different combination of power, storage capacity and capital cost in each case.
Cycling belongs inside the sizing analysis. For every candidate configuration, the model should determine a feasible hourly charging and discharge schedule, estimate its effect on battery life, and translate the resulting energy flows into lifetime project cash flows.
The same energy throughput can require different battery sizes
Consider an illustrative requirement to discharge 110 MWh per day at the battery side. Relative to initial battery capacity, an 80 MWh system would deliver 1.375 equivalent full cycles, a 100 MWh system 1.1 cycles and a 125 MWh system 0.88 cycles.
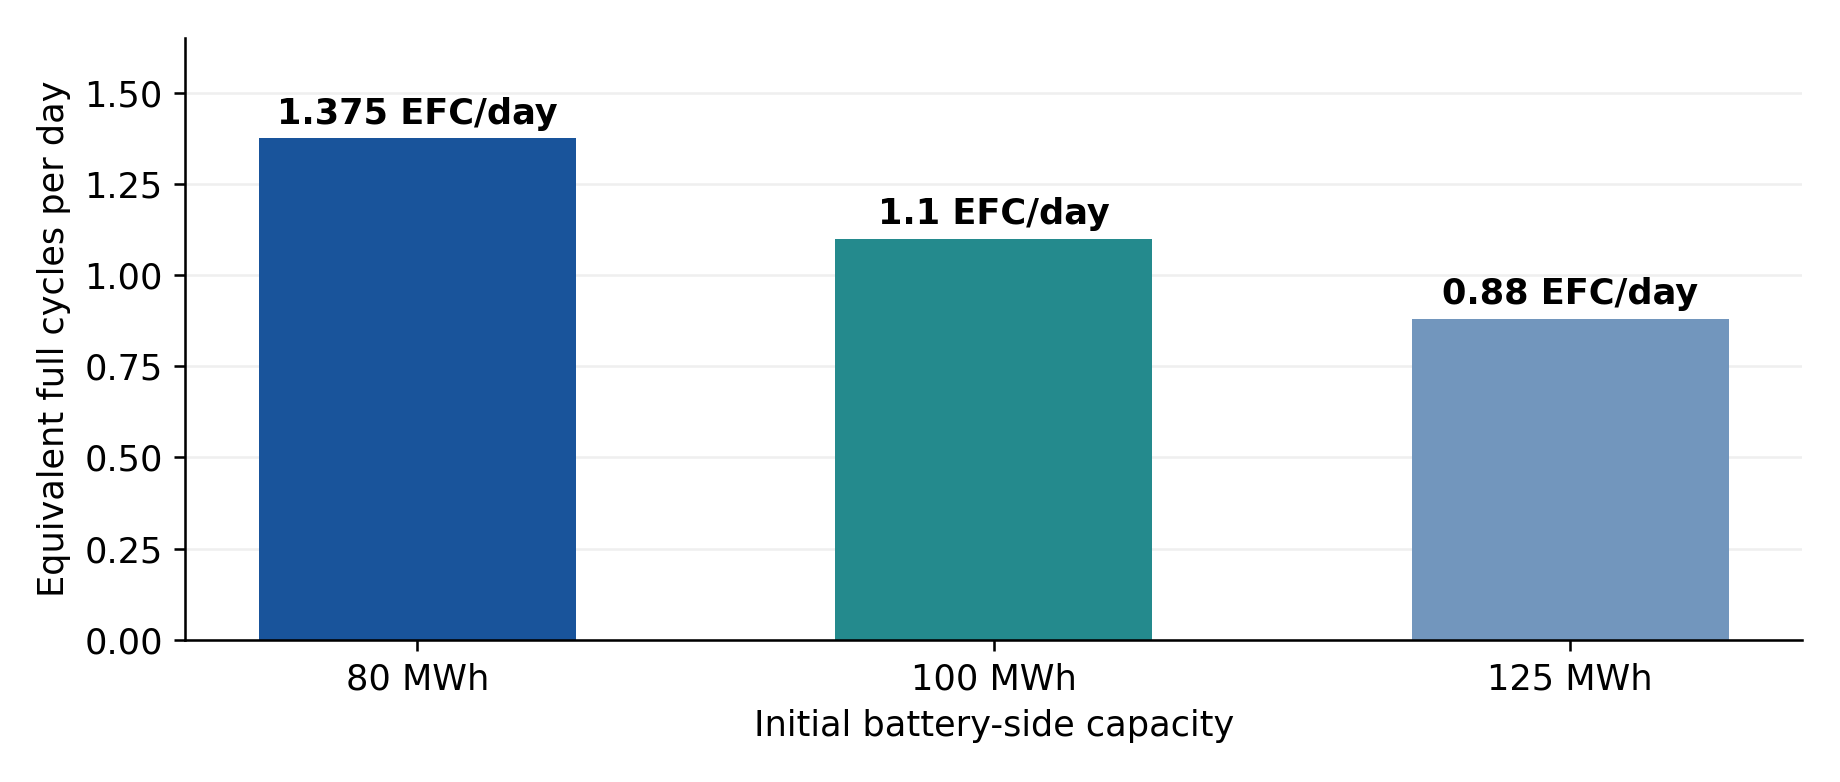
Figure 1. Illustrative arithmetic at 110 MWh/day of battery-side discharge. EFC/day = daily discharge throughput ÷ initial battery-side capacity. These are not optimised project results.
The smaller battery requires more turnover of its stored energy. The larger battery provides more capacity with less cycling intensity. Neither is automatically the better investment: their costs, charging opportunities, degradation and revenue potential must be compared.
Throughput above one cycle requires recharging within the operating schedule. SOC limits and losses must also be respected; this illustration does not establish that each configuration can achieve the target at a particular site.
Power determines which price opportunities can be captured
Storage capacity in MWh determines how much energy can be held. Power in MW determines how quickly it can be charged or discharged. Both affect the markets and price windows a BESS can serve.
For 100 MWh of usable energy, a 25 MW system has an ideal four-hour discharge duration. At 50 MW that becomes two hours, and at 100 MW one hour. These examples use energy and power at the same measurement boundary and neglect variation in losses.
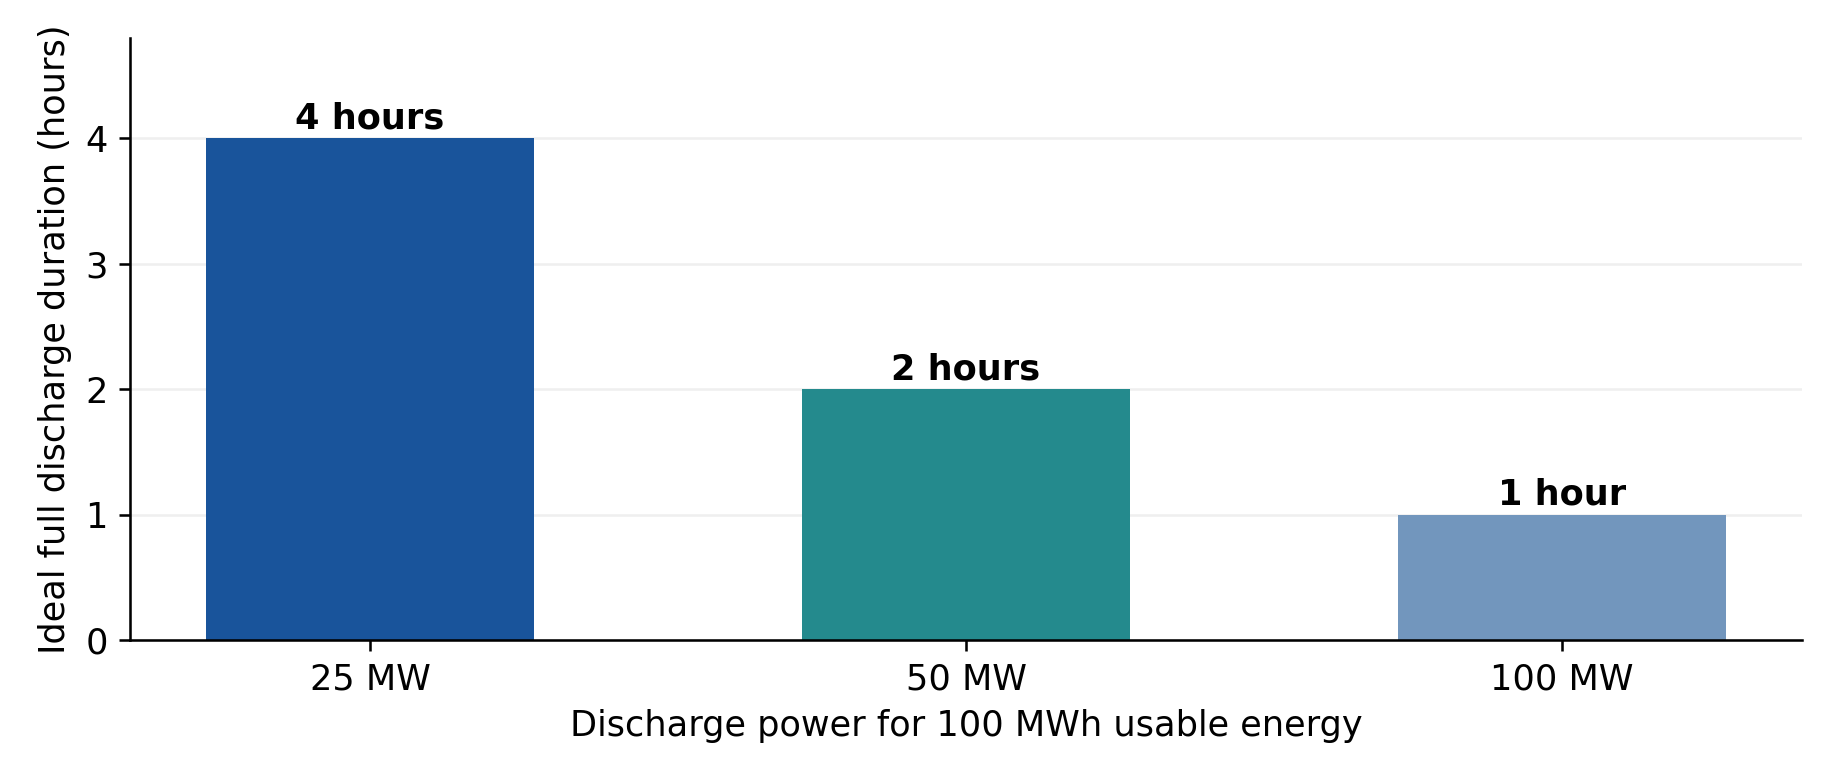
Figure 2. Illustrative duration at 100 MWh usable energy. Duration = usable energy ÷ discharge power. Higher power can concentrate discharge into fewer hours, subject to connection and equipment limits.
If the highest prices occur in a short window, extra power may increase the value captured. If attractive prices persist for several hours, additional energy capacity may be more useful. The result also depends on how quickly the battery can recharge and whether sufficient low-cost energy is available.
Allow fractional cycling in the hourly schedule
An hourly model should choose a continuous charging or discharge power for each interval. An extra hour does not necessarily represent an extra full cycle. For a 100 MWh initial battery, a battery-side discharge of 10 MW for one hour adds 0.1 equivalent full cycle; 25 MW for one hour adds 0.25.
This allows the operating intensity to move up or down with market conditions. Keep stored energy continuous across midnight, prevent simultaneous charging and discharge, and impose only the cycle or throughput limits required by the actual warranty and operating conditions.
A reported annual average of 1.1 EFC/day could include quiet days below one cycle and stronger days above it. A contractual annual throughput allowance should not be converted into a rigid daily quota unless the contract requires that restriction.
The next increment must earn its cost
The decision to move from 1.0 to 1.1 cycles should depend on the value of that additional energy movement. Its extra sales revenue must exceed charging costs, energy losses, applicable variable charges and the economic cost of additional battery ageing. It must also be compared with any more valuable opportunity displaced later.
A positive price spread alone is insufficient. Charging requires more energy than the BESS subsequently delivers, and operation can accelerate future augmentation or replacement. The sizing model needs to capture those effects over the project life.
Separate capacity ageing from efficiency losses
A study by Grimaldi and colleagues examined a 500 kW / 822 kWh NMC BESS and modelled cycle and calendar capacity loss separately. Its first-year estimates were 0.538 percentage points from cycling and 1.19 from calendar ageing. These results illustrate why increasing throughput by 10% does not automatically increase total annual degradation by 10%. [1]
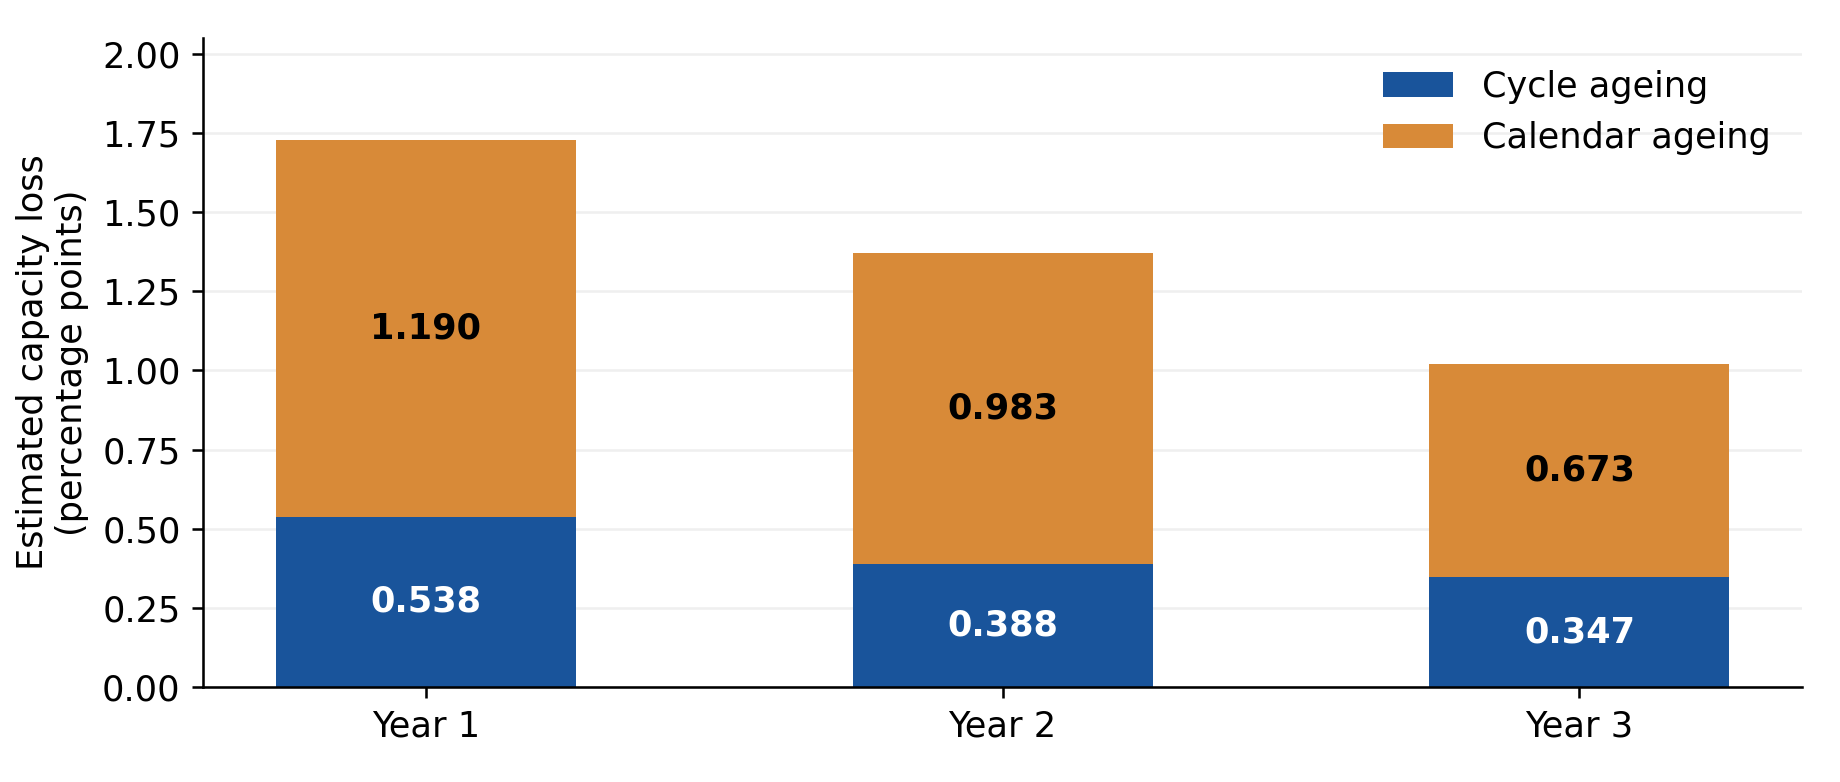
Figure 3. Estimated annual capacity loss from Table 4 of Grimaldi et al. (2023). Model-derived results for the studied NMC system, not CATL LFP parameters or a forecast for another project. Figures are percentage points of initial capacity.
The same study measured lower AC efficiency at low operating power and identified auxiliary consumption during operation and idle periods. These findings support modelling efficiency and auxiliaries with operating conditions where data are available. They do not establish a universal relationship between cycles per day and round-trip efficiency. [1]
Capacity retention determines how much energy remains available. Round-trip efficiency determines the relationship between charging energy and delivered energy. They should be modelled separately, with measurement boundaries and auxiliary losses defined consistently.
Connect sizing and dispatch to project finance
The investment model should evaluate each feasible MW/MWh combination using the same prices, operating rules and financial assumptions. Within each configuration, optimise hourly dispatch and then calculate lifetime cash flows with degradation, augmentation, operating costs and financing treated consistently.
- Define candidate battery power and storage capacity, including connection limits, charging permissions and supplier constraints.
- Optimise the hourly schedule and calculate actual energy throughput and fractional cycling. Account for the opportunity cost of PV energy used for charging in hybrid projects.
- Estimate capacity and efficiency changes over time using appropriate supplier data. Update dispatch when declining capacity or augmentation changes the feasible schedule.
- Calculate lifetime revenue, costs, investment requirements, NPV and project or equity IRR on a consistent basis.
- Test alternative price forecasts, wear assumptions and warranty conditions. Distinguish perfect-foresight benchmarks from achievable operating forecasts.
Cycling, sizing and project finance therefore form an iterative calculation. A smaller battery may save capital but require greater throughput intensity. A larger battery may earn additional revenue or delay replacement, yet still fail to justify its extra investment. Higher annual revenue alone does not demonstrate a better IRR.
What to ask before fixing the BESS configuration
Can a different charging and discharge schedule change the preferred MW or MWh?
Yes. Power and storage capture different price windows, so the hourly schedule can change which MW/MWh combination is the better investment.
Does an additional 0.1 cycle create enough lifetime value to justify its wear?
Only when the extra sales revenue exceeds charging cost, losses, variable charges, and the economic cost of additional battery ageing, and it does not displace a more valuable later opportunity.
How sensitive is the selected size to future spreads, charging access and augmentation costs?
Test alternative price forecasts, wear assumptions and warranty conditions before the battery configuration is fixed.
These questions should be answered before committing to the battery configuration. They turn a fixed cycling assumption into a tested investment choice.
At Optimus Consulting, we connect PV and BESS sizing and dispatch analysis with project finance to help developers and investors evaluate configurations and their investment implications.
Research reference
[1] Grimaldi, A., Minuto, F. D., Perol, A., Casagrande, S. and Lanzini, A. (2023). Ageing and energy performance analysis of a utility-scale lithium-ion battery for power grid applications through a data-driven empirical modelling approach. Journal of Energy Storage, 65, 107232. Table 4 and Sections 4.3–4.5. https://doi.org/10.1016/j.est.2023.107232
Figures 1 and 2 are illustrative calculations by Optimus Consulting. Figure 3 reproduces the numerical estimates in the cited study. None of the charts represents a validated optimal configuration or a quantified IRR improvement for a specific project.